Thursday, 8 November 2012

4 Steps to choosing an Economics Commentary article

Many a time, students face difficulty in finding a suitable news article for their Economics Commentaries. These four steps will sort out this problem.


Step 1

Goto google.com

Step 2

Type the keyword on which you want to write your commentary. For example, inflation, fiscal policy, monetary policy, interest rates, etc.

Step 3

Choose News as the option from the Toolbar on the google page.

Step 4

Google will display the latest news articles on that topic. Now, choose a suitable article.
If you don't find a suitable news article then goto Step 5

Step 5

Adjust the publishing date of the article from the left panel to get access to more news articles.


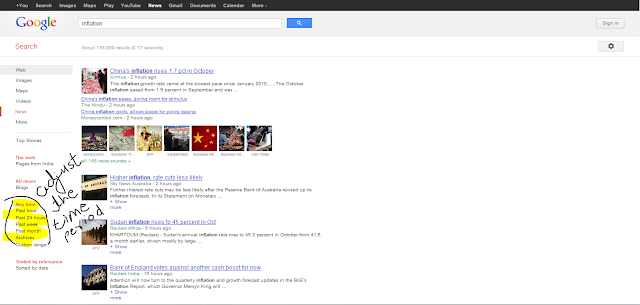
However, the news should not be more than one year old from the time of writing the commentary.

Wednesday, 7 November 2012

How to draw Economics diagrams

Drawing Cost/Revenue curves and Market structure curves is usually a confusing affair for students. Just follow these 4 steps and you will never go wrong with your diagrams. There is a detailed PowerPoint presentation on dineshbakshi.com which illustrates all these steps. Click here to goto to the Presentation page

Step 1

Draw a Revenue Curve i.e. MR & AR curves

Step 2

Now place revenue curves i.e. AC and MC curves.
  • If there is abnormal profit the AC curve will be below the AR curve.
  • If there is loss then the AC curve will be above the AR curve.
  • If the firm is having normal profit then the AC curve touches the AR curve.

Step 3

Now, identify the output level of the firm. It is always be the profit maximisation level, i.e. the point where the MC cuts the MR.

Step 4

At the profit maximisation level, identify the cost on AC curve and the revenue at AR curve. The difference will give to abnormal profit and loss accordingly.

Congratulations!! You have completed the diagram.