Wednesday, 7 November 2012

How to draw Economics diagrams

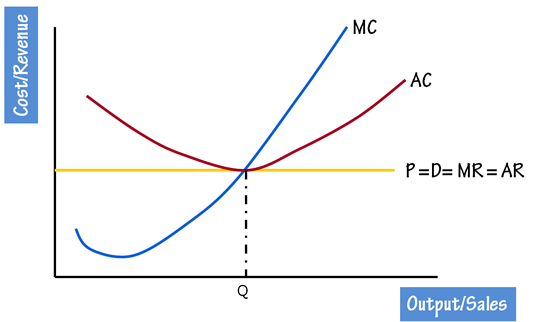
Drawing Cost/Revenue curves and Market structure curves is usually a confusing affair for students. Just follow these 4 steps and you will never go wrong with your diagrams. There is a detailed PowerPoint presentation on dineshbakshi.com which illustrates all these steps. Click here to goto to the Presentation page

Step 1

Draw a Revenue Curve i.e. MR & AR curves

Step 2

Now place revenue curves i.e. AC and MC curves.
  • If there is abnormal profit the AC curve will be below the AR curve.
  • If there is loss then the AC curve will be above the AR curve.
  • If the firm is having normal profit then the AC curve touches the AR curve.

Step 3

Now, identify the output level of the firm. It is always be the profit maximisation level, i.e. the point where the MC cuts the MR.

Step 4

At the profit maximisation level, identify the cost on AC curve and the revenue at AR curve. The difference will give to abnormal profit and loss accordingly.

Congratulations!! You have completed the diagram.


Sunday, 14 October 2012

Flashcard quiz- Development Economics


Here is a flashcard quiz on Development Economics unit for IB Economics

Flash Card quiz - International Economics

Here is a collection of important terms for International Economics Unit. Flashcard quiz

Flash Cards - Macroeconomics

Here is a collection of important terms for Macroeconomics. An interesting flashcard quiz.

Flashcard- Microeconomics

Here is a flashcard quiz on Microeconomics terms for Economics students. Check you knowledge.

Saturday, 19 May 2012

PowerPoint Presentations for IB Economics

Hi there,
I have recently uploaded a number of PowerPoint Presentations on my site www. dineshbakshi.com.
These PowerPoint Presentations are crisp, to the point and an excellent tool for revision. Teachers are most welcome to use these presentations in their lessons. I have tried to make them colorful and interesting. I am sure our young audience will find them captivating and would appreciate them.
Utmost care has been taken to see that the content is correct and relevant. However if there are any issues regarding the content then please let me know so that I can make the necessary corrections.
Here is the link to these presentations.
Thanks and cheers.

Getting a 7 in IB Economics - Post 1

Dear students,
In this series of 'Getting a 7 in IB Economics' I would be giving you useful tips on how to improve your grades in IB Economics. In this particular post I am going to state 5 things which are a must when it comes to writing an excellent extended response question.

5 Commandments for getting good grades in IB Economics


  1. Always define terms accurately: Whenever you use a economic term, define it accurately. When I say ' accurately', I mean  you have to use the key terms which make a definition complete. For example, Inflation is a persistent rise in the average price level of goods and services over a period of time. Here, the key words are 'persistent', 'over a period of time'. Without these key words the definition might be considered as vague and you will end up getting only half the marks.
  2. Use diagrams effectively: IB Examiners love diagrams. Use appropriate diagrams to explain your answers/concepts. Students are expected, where appropriate, to include correctly labelled and clearly drawn diagrams.Drawing a diagram is not enough, it has to be explained also. For example, while explaining demand pull inflation on an AD/AS diagram the student can write.... 'The increase in AD from AD1 to AD2 will lead to a increase in real output from Y1 to Y2, however it will also lead to a rise in general price level from PL1 to PL2
  3. Structure your answer: An extended response questions should have a logical structure. The arguments and discussion should have logical flow. A good answer will have relevant concepts developed in reasonable depth, demonstrate effective evaluation, supported by appropriate evidence or theory.
  4. Application : Students are expected, where appropriate, to illustrate their answers with examples in order to reach the highest markbands. Always use real life examples to strengthen your answer. In case you are doing a data response question then refer to the text and make effective use of data presented. 
  5. Evaluation is very important: Effective evaluation consists of  considering the short run versus long run consequences of a phenomenon/decision on on different stakeholders. Discussion of its advantages and disadvantages.

 Coming next... Attempting Paper 1